As a small business or a startup, you’re always trying to stretch one dollar into five. Every investment you make needs to serve multiple purposes and have a measureable ROI. And that includes your website.
Your company’s website can be a major investment from initial design and development to regular maintenance. A website, though, is the gateway to your audience, your sales platform, and fact sheet for investors. Dedicating time and funds to this tool is imperative to your company’s success. In addition, you’ll need to measure its effectiveness to help you reach your business goals and attract new customers. So how do you do it?
The following reports from Google Analytics will help you understand who is visiting your site, where they’re coming from, what they’re using it for and ultimately, how you can improve your website to reach your goals.
Who is visiting your website?
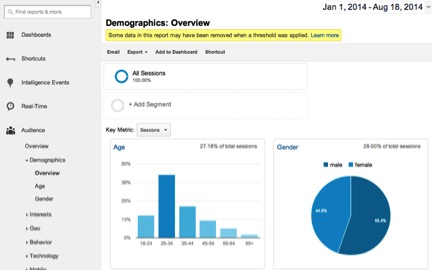
As with any marketing initiative, you first want to understand who you’re talking to on your website. Determining the lifestyle, gender or buying habits of your audience will help you to optimize your website specifically for them. Everything from content to the site structure can be adjusted based on your audience profile.
The Audience reports within Google Analytics (Audience > Demographics > Overview) can show you exactly who is engaging with your website. You or your developer will have to simply enable a setting in the Analytics admin and change the tracking code on your site, which will then allow you to see demographic data. The information will be broken down by age, gender, lifestyle interests and content they consume. Once you have a greater idea of who you’re attracting to your site, you can make strategic decisions on the content you share on your blog, the spokespeople you tap for your brand and the kind of information to share with your visitors.
Where is your website traffic coming from?
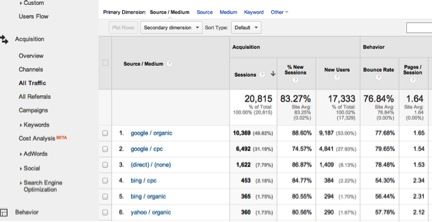
Additional marketing efforts like newsletters, social media and guest blog posts are great ways to drive traffic back to your website. Google Analytics allows you to evaluate these efforts with the All Traffic report (Acquisitions > All Traffic), which shows you where your visitors are coming from.
Understanding whether your Twitter account or your monthly emails are responsible for the uptick in engaged visitors will help you to make decisions on how to better promote your site. For example, if you see that your email newsletter converts at a significantly higher rate than your social media activity, then this is a sign to focus more energy in this area. That may mean implementing a more frequent plan for email blasts, investing more time on content, or freshening up your design. By focusing on attracting a more engaged audience, your site will deliver more customers, users or investors.
How is your audience using your website?
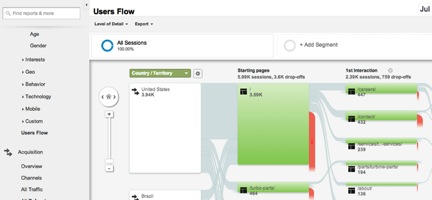
You may be driving traffic to your site but learning how they’re navigating through the pages will give you a better idea of what is appealing to them and where they’re losing interest.
The User Flow report (Audience > Users Flow) allows you to track individual paths through your site to learn how users in a given segment are interacting with your content. This report allows you to track all site traffic, as well as users in a given segment. For example, if you want to track how well your site is performing on mobile then you can use this report see where they enter the site, what clicks they make and where they exit. If you notice that a number of visitors are leaving the site on a particular page, you may want to reevaluate the content or imagery – figure out what’s causing people to leave.
Your website is much more than an “About Us” page. It’s an important part of lead generation, educating customers on your product or service, and persuading potential investors to fund your startup. By understanding the activity on your website, you’re able to set and achieve realistic goals for your organization. You may not be a Google Analytics expert, but you can use a Web reporting tool like Megalytic to create customized analytic reports to share with your business partners, employees or investors to help them understand the success of your site (and business!) in terms they’ll understand. Experiment with the different reports and graphs within Google Analytics; by investigating the vast amount of information available you may be inspired to find new ways to improve your website.


